Contents
| 2.3 Web Mapping | Contents |
There are a number of terms which describe the electronic illustration of maps on the Internet - among the more commonly used are: Internet Map, Web Map, net-based e-map, Cyber Map etc.
Jens Fitzke also defined three general terms to be used for these types of maps [Fitzke 1999]:
GIS online is used as a collective term for all types of GIS applications which are available through a network.
Internet-GIS narrows this focus to network technology based on specific protocols.
In most cases the term can be even further defined by assuming the existence of a specific client (the web browser), leading to the term WebGIS.
On the other hand, Frank Dickmann uses the terms WebMapping und
WebGIS to classify the electronic illustration of maps on the Internet.
Web Mapping is derived from the term Web Map although it is more strongly associated with the map production process. Web Mapping includes not only the visual presentation of maps on the Internet, but also simple viewing features such as Zooming, Panning as well as Layering. However, these features are not yet considered »GIS adequate« [Dickmann 2004].
The term WebGIS is used to indicate a user's ability to modify attributes beyond the usual Web Mapping functions, as well as to perform additional GIS operations (such as keyword searches, search functions, area and distance measurements).
However, since basic GIS analysis functions such as attribute searches are also associated with Web Mapping, it becomes clear that a clear demarcation line between Web Mapping and WebGIS does not exist [Dickmann 2004].
This thesis will use the term Web Mapping as described by Frank Dickmann, which also includes the simple analytical functions found in a GIS system.
Web mapping applications are classified into static and interactive maps, depending on their degree of interactivity [Mitchell 2005].
Static maps or view-only maps are ready-made maps which are integrated into the website as a stand-alone picture.
In the early stages of web mapping development paper copies of maps were scanned and subsequently shown on the Internet in bitmap format.
This resulted in a considerable on-line collection of static maps, which is still widely in use today [Dickmann 2004][Mitchell 2005].
The introduction of interactive maps provided users with the option to adjust map sections to suit their individual needs, as well as to obtain additional information by panning images, zooming in, activating other map layers or requesting map-related information. At each change the map section is redrawn and displayed with the new information [Dickmann 2004].
From a technical view the distinction between static and interactive mapping illustrations is not an easy one to make. For example, a map which has been altered by panning and/or zooming would still be considered a static map [Dickmann 2004] if the zooming function merely changed the scale of the map without revealing any new detail ie. information.
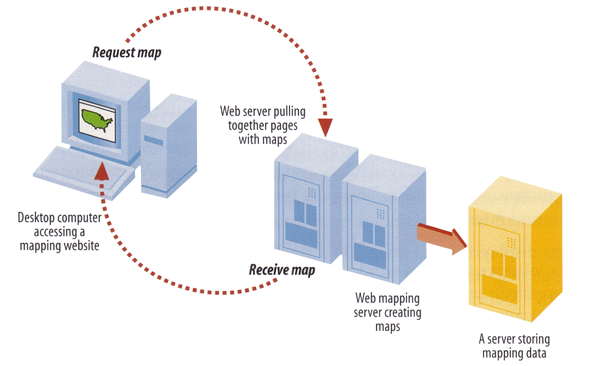
The client-side server model forms the basis of Web Mapping and WebGIS applications, whereby a web browser becomes the client communicating with the web server. Figure 2.3.3 illustrates this process: The client requests a map by sending an inquiry to the web server. The web server directs the inquiry to the map server which evaluates the inquiry, searches for the relevant geographical data and generates the corresponding map. The map is then sent to the web server, where it is integrated into a HTML page and sent back to the client browser [Klauer 2002][Mitchell 2005].
On the client side, the existence of a web browser is the only prerequisite for using a web mapping application. A standard browser will usually be able to illustrate raster data in GIF, JPG and PNG format.
However, vector data ara not yet supported by all browsers. One example is Mozilla
Firefox2 (Version 2.0) which supports the SVG 1.1 specification3. Because this type of SVG standard is not yet widely supported by web browsers, vector data does not figure significantly in current web mapping applications. The topic of web mapping in conjunction with vector data will not be discussed in further detail at this point, as it is not relevant to the work presented herein (see [Kunze 2006][Langfeld 2006] for more information).
On the server side, a web server (e.g.
Apache4) along with a specific map server is required, whereby the latter does not have to be installed on the same computer (same applies to the geodata base) [Klauer 2002].
The UMN MapServer5 is a free and very popular map server which communicates with the web server via a Common Gateway Interface (CGI). Many web mapping applications are based on the UMN MapServer (see Chapter 3.1). Two other significant map servers are Geoserver6 and deegree7.
What are the main characteristics of a web mapping application? This section provides a general introduction to the main components and interactive potentials of a web mapping application. Section 3.1 provides a detailed analysis of selected web mapping applications.
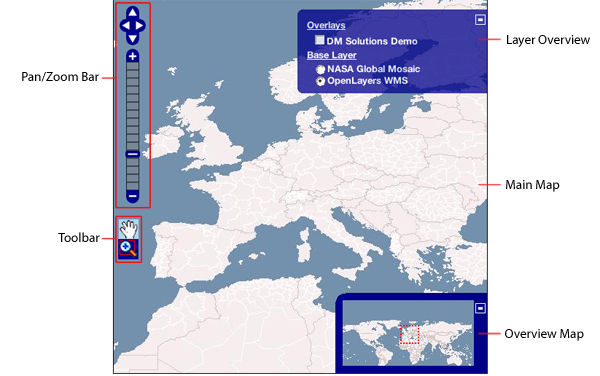
Generally speaking, the user interface of web mapping applications consists of the following components (Figure 2.3.4 shows several of these using the example of OpenLayers):
With the growth of the Internet and the growing popularity of web mapping applications the concept of interactivity has become a fundamental component in the development and usability of mapping applications [Ebinger u. Skupin 2007].
Critical to this development is the ability to navigate around a map, allowing the user to adjust the map by using Drag&Drop per mouse click. By clicking on the panning arrows the map can also be panned in predefined increments.
Changing the zoom level of a map can be done in a variety of ways: clicking on the + or - button, double-clicking on the map, using the mouse to open a zoom box, moving of zoom slider or mouse wheel.
Some web mapping applications also offer panning and zoom navigation options using the keyboard (see Chapter 3.1).
Often the user can also change the view of the currently selected map portion in the overview map (by mouse click or Drag&Drop), which will also change the main map accordingly. In the same vein, the overview map is updated along with changes made to the main map.
In the layer overview, interactivity includes the ability to turn layers on and off by means of check boxes or buttons, and to combine layers into one main layer.
Toolbar functions represent varying degrees of interactivity, including the already mentioned pan/zoom functions as well as options related to printing, querying, object selection, distance measurements and getting directions.
Two additional interactive features in web mapping applications are represented by cursors showing the current ground location, and individually adjusted map sizing. Some web mapping applications also offer users the ability to make queries about geographically referenced objects or obtain more information on other items, thereby creating a highly interactive environment.
All of the above-mentioned features contribute to the interactive nature of a web mapping application. The increasing trend towards Web 2.0 and AJAX has also resulted in noticeable interactivity improvements in the web mapping area. One of the highlights in this area is the asynchroneous data transfer through the XMLHttpRequest object, as it allows websites to be refreshed in the background instead of having to be re-loaded after every modification. Because of this technology, a web mapping application is able to execute a user's command in a fairly short time period, as the necessary steps can be completed in the background. As a result, the usability of interactive web mapping applications is approaching the features of classic Desktop(GIS) applications [Dickmann 2001][Kunze 2006].
Tiling is a fairly new development - it involves the division of maps into smaller tiles in order to increase the usability of web mapping applications.
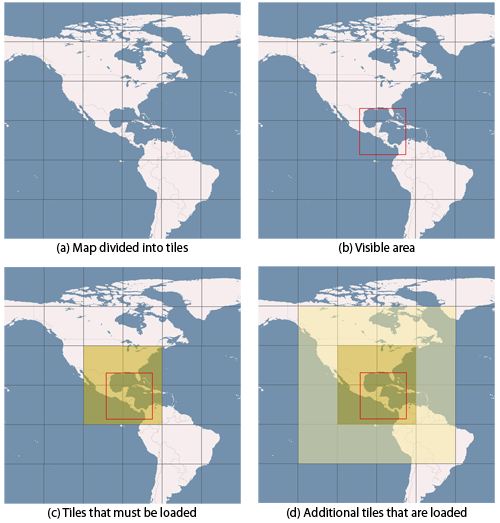
The following section provides a general discussion of the tiling method, using Figure 2.3.5 [Langfeld 2006][Kunze 2006]:
In order to create an optimum web mapping environment (ie. not burdening the application with extraneous data), the application's maps are initially divided into tiles (a). In effect, each tile is a small map on its own, however, in combination with the other tiles it forms one complete map and is not visually distinguishable as a separate unit. Once a specific map area is selected (b), all tiles which are completely or partially visible in this area must be loaded (c). In addition, all tiles which border the selected area but are not visible are also loaded (d). If the user moves or adjusts the map, the tiles loaded in (d) are now shown without delay. At the same time, all remaining tiles which now border the new selected area (but are not yet visible) are also loaded for future use, while the tiles no longer bordering on the new area are removed.
Tiling can be done in two ways: client-side or server-side. In client-side tiling the web mapping client defines the tiling boundaries and requests each tile from the map server. In server-side tiling the server divides the map into smaller tiles and sends these to the web browser which then displays the data on the computer.
Generally the web mapping application performs a client-side management of the loaded tiles, whereby the tiles are stored in a DOM tree that represents the current HTML website. As soon as the selected map area is changed, the program calculates the new tiling arrangements, removes the now extraneous tiles and adds the tiles required for the new selection.
Even though this »tile preloading process« involves a higher amount of data transfer, it significantly increases the speed of web mapping operations, particularly the navigation within maps (Map Browsing).
Each zoom level has its own »tile grid«, with uniform tile sizes for each zoom level (usually 256 pixels). During a zoom-in function the height and width of each tile are doubled, that is, each tile is divided into four new tiles, each containing more detailed information. During zoom-out the process is reversed: four tiles are combined into one tile.
© June 1, 2007 |
Emanuel Schütze |
some rights reserved.
This work is licensed under the Creative Commons License
Attribution-ShareAlike 2.0 Germany.
| 2.3 Web Mapping | Contents |